
In Agile, it’s not just about moving fast—it’s about knowing how fast you’re moving. And that’s where velocity becomes invaluable.
Much like a speedometer on a vehicle, velocity offers real-time insights into how fast a team is progressing toward its goals. It’s not just a number—it’s a compass for better planning, improved delivery, and smarter decision-making.
As Agile adoption continues to expand across industries—from fintech to healthcare—Sprint velocity has become one of the most trusted metrics for gauging performance, forecasting capacity, and identifying areas for improvement. But like any Agile metric, its value lies in how you use it—not just in how you measure it.
Let’s break down what Sprint velocity really is, how to measure it accurately, and why it should be a core part of your Agile toolbox in 2025.
What is Sprint Velocity in Agile 🚀
Sprint Velocity measures the amount of work a team can complete during a single Sprint. This is typically represented in story points, but can also be measured in completed stories or hours—whatever unit your team consistently uses.
The true strength of velocity lies in its predictive power. When tracked across Sprints, it gives teams a realistic view of how much work they can commit to—helping avoid burnout, under-delivery, or mid-Sprint chaos.
⚠️ Important: Velocity is a team metric, not an individual scorecard. It reflects collaboration—not personal performance.
How to Calculate Sprint Velocity (Step-by-Step) 📏
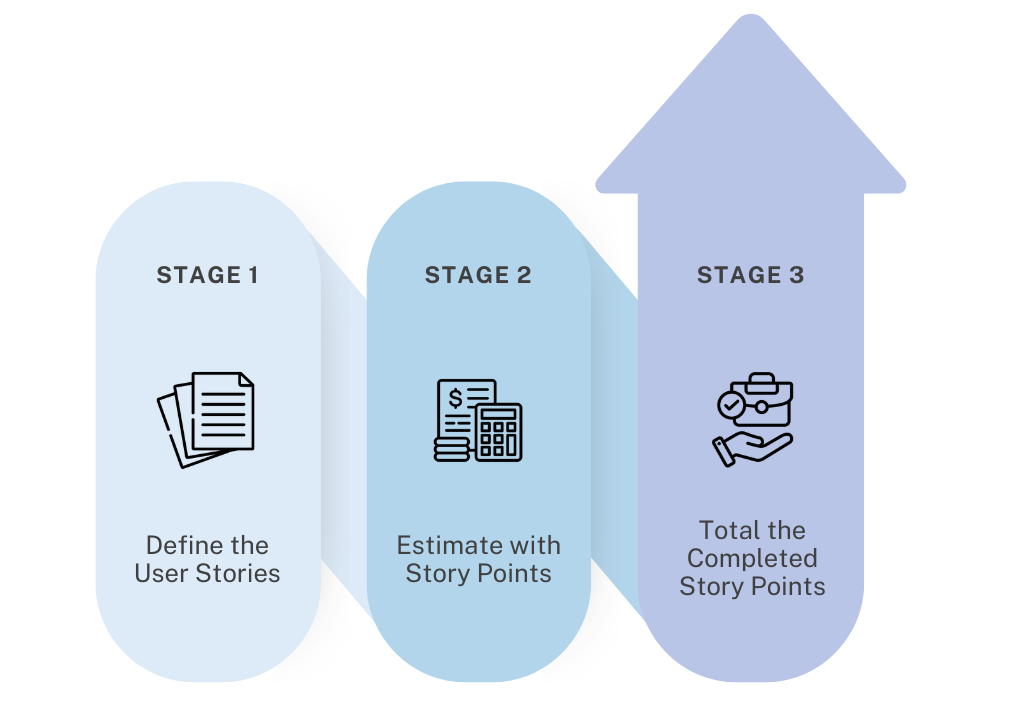
Sprint velocity may seem simple, but when calculated with intention, it offers deep insight into team performance. Here’s how to get it right:
1. Define the User Stories
Start with well-crafted user stories—brief, value-focused statements written from the end-user’s perspective.
Example:
“As a seller, I want to bulk upload products so I can save time managing inventory.”
Why it matters:
- It keeps the team focused on delivering real user value
- It supports clearer task breakdown and prioritization
- It aligns the team around outcomes, not just output
Break down large stories into smaller ones to ensure they’re deliverable within a Sprint.
2. Estimate with Story Points
Next, assign story points to each user story. These points reflect the effort, complexity, and risk involved.
It’s not about how many hours something takes—it’s about how “big” or “hard” it feels compared to other tasks.
Teams typically estimate story points together, considering:
- Complexity – Is it technically challenging?
- Dependencies – Does it rely on something else being done first?
- ️Risk or Uncertainty – Could delays or blockers arise?
- Past Experiences: Have we tackled similar stories before?
- Collaboration Needed: Will this need cross-team input?
- Effort & Testing: How much work is needed to build and test?
💡 Pro Tip: Most teams use the Fibonacci sequence (1, 2, 3, 5, 8, etc.) to keep estimates relative and avoid over-precision.
3. Total the Completed Story Points
At the end of your Sprint, it’s time to calculate velocity.
Only count the story points for fully completed user stories. If something is only half-done—it doesn’t count. This encourages smaller, shippable chunks of work.
Here’s a quick example:
Story A: 4 points
Story B: 2 points
Story C: 3 points
Story D: 5 points (not finished, not counted)
Total Velocity: 4 + 2 + 3 = 9 story points
Over time, your team will establish a consistent average velocity, which becomes your benchmark for future Sprint commitments.
Why Measuring Sprint Velocity Matters 📊
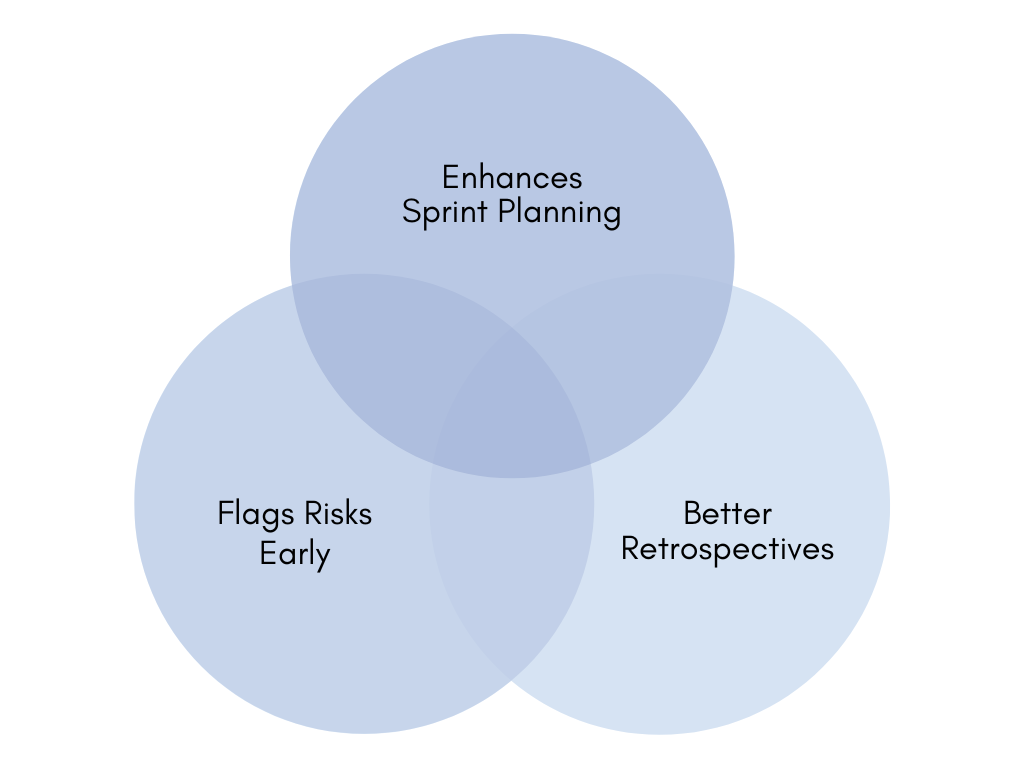
1. It Enhances Sprint Planning
Your average velocity helps you commit to the right amount of work. If your team typically delivers 24 points, aim for stories that add up to that—not more.
2. 🚨 It Flags Risks Early
A sudden dip in velocity can signal burnout, hidden blockers, or unclear requirements. Monitoring it helps you respond before minor issues derail entire Sprints.
3. Better Retrospectives
Velocity provides a starting point for meaningful discussions.
💬 Example: “We only completed 18 points this Sprint—down from 25. What changed?”
It leads to valuable insights on processes, priorities, or team dynamics.
Visualizing Sprint Velocity 📊
Raw numbers are helpful—but charts make velocity actionable.
Velocity Chart
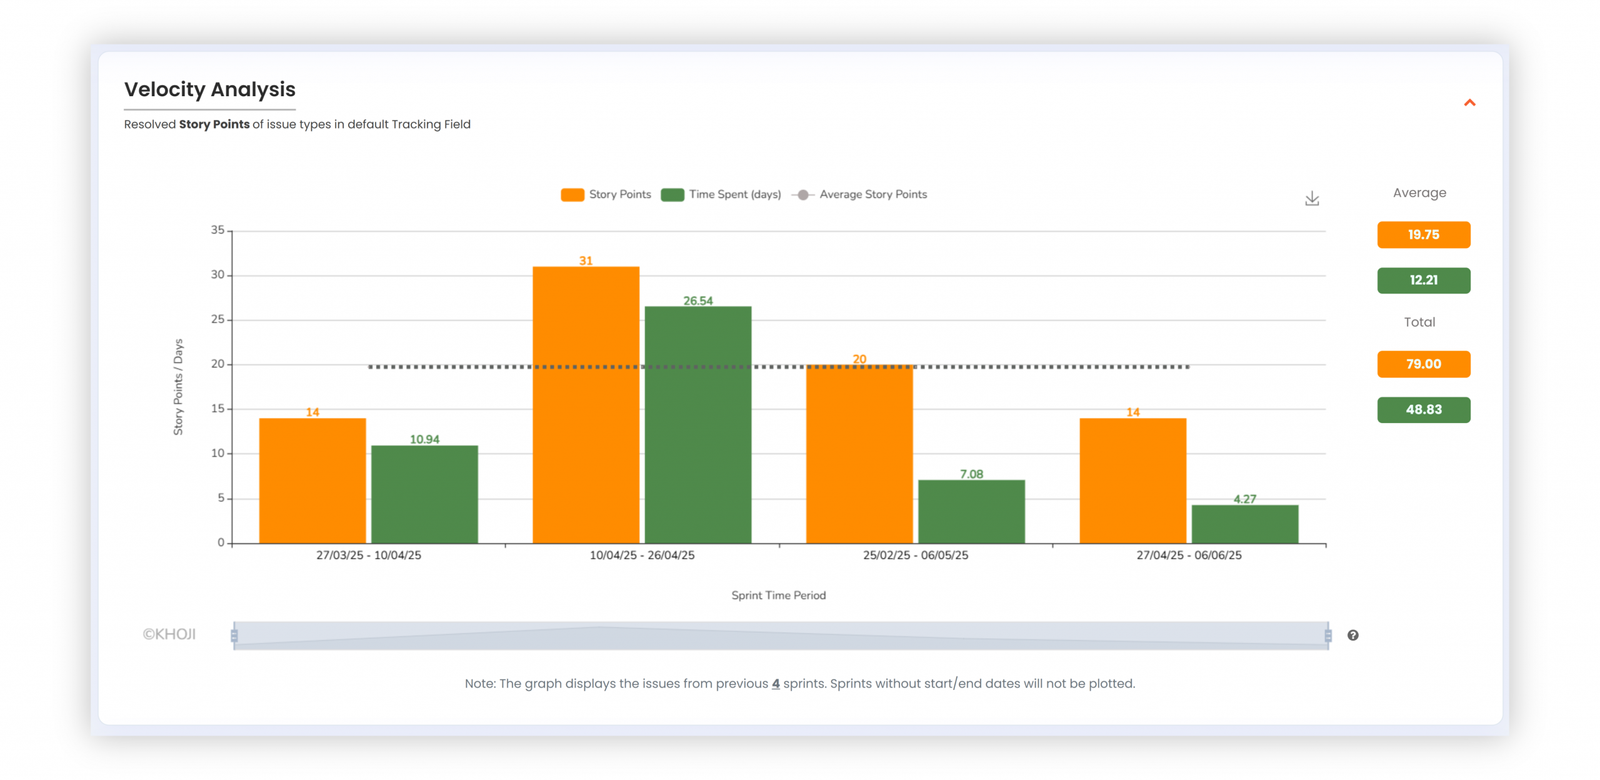
A bar chart comparing planned vs. actual story points across Sprints.
- X-axis: Sprint number/time period
- Y-axis: Story points/days
- Use it to quickly spot underperformance or consistency trends.
Burndown Chart
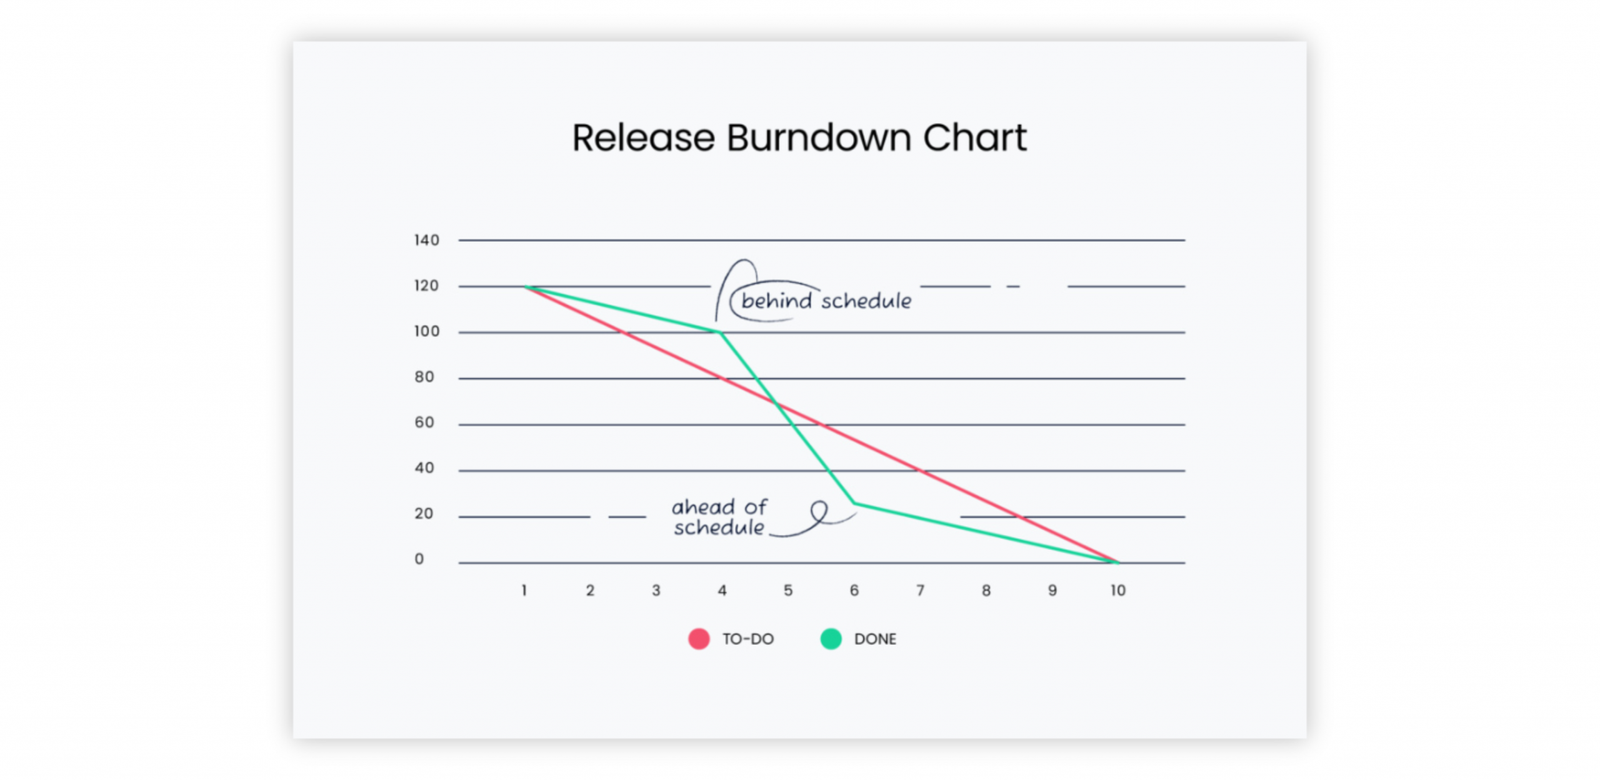
A line chart tracking remaining work across the Sprint timeline.
- Ideal for tracking Sprint progress day-by-day
- Helps teams avoid last-minute crunches and identify uneven work distribution
Don’t Let Velocity Become a Vanity Metric ⚠️
Velocity isn’t a KPI or a leaderboard. Using it to compare teams—or push them to “increase points”—does more harm than good.
Misusing velocity can lead to:
- Inflated estimates
- Point chasing instead of value delivery
- Unhealthy team competition
Instead, treat velocity as a guidepost. Combine it with qualitative insights: retrospectives, customer feedback, and team morale.
Conclusion: Get Better at Velocity, Not Just Faster ✅
Sprint velocity is one of Agile’s simplest yet most meaningful metrics—when used well. It helps teams plan realistically, track progress transparently, and improve continuously.
And with Khoji for Agile, analyzing velocity is easier than ever. From surfacing cross-team patterns to identifying Sprint trends, Khoji helps your Agile engine run smoother, with healthier teams and more predictable outcomes.
Ready to make your next Sprint your smoothest yet?
👉 Start exploring velocity insights with Khoji for Agile.